Introduction
There's a number that surprises most Phase I awardees when they first see it: NSF SBIR Phase II has a success rate approaching 50%. That sounds almost too good compared to the brutal single-digit Phase I odds — but the comparison is misleading. The applicant pool is fundamentally different at Phase II, which explains most of the gap.
But "higher odds" and "easier path" are not the same thing. A $1.25 million, two-year award demands far more than technical promise. NSF expects demonstrated Phase I results, a concrete commercialization roadmap, and evidence that your team can execute — not just hypothesize.
This post is for small businesses and research teams that have secured (or are actively pursuing) NSF SBIR Phase I funding and want an accurate picture of Phase II. It covers:
- The actual success rate data and what drives it
- How Phase II is structured differently from Phase I
- What the award can include beyond the base amount
- What separates funded proposals from rejected ones
- How NSF compares to peer agencies across the broader SBIR landscape
Key Takeaways
- NSF SBIR Phase II success rates ranged from 43% (FY2017) to 49% (FY2022), far exceeding Phase I's 11% acceptance rate
- Only Phase I awardees can apply for standalone Phase II, which naturally filters the applicant pool
- The base Phase II award is up to $1.25 million over 24 months, with supplement programs that can add significantly more
- NSF evaluates Phase II on three criteria: Intellectual Merit, Broader Impacts, and Commercial Potential (the only criterion unique to SBIR)
- Proposal quality, Phase I progress, and a credible commercialization plan are the variables you can control most
NSF SBIR Phase II Success Rates: What the Data Actually Shows
The Numbers
The most recent cross-agency data comes from the SBA's FY2022 Annual Report, which puts NSF SBIR Phase II at a 49% selection rate. The FY2017 SBA Annual Report shows 43% (107 awards from 246 proposals). That gives a confirmed historical range of 43%–49% across those benchmark years.
For context: NSF SBIR Phase I in FY2022 came in at 11%. The Phase II rate is not just higher — it's a structurally different competition.
On program scale, NSF's current solicitation (NSF 26-510) estimates approximately 80 SBIR Phase II awards per year, down from the ~107 seen in FY2017. These are estimation figures from the solicitation, not final FY2024 counts. For the most current award statistics, check NSF's seed fund website and the SBA's annual report archive.
Why the Rate Is High — And What That Doesn't Mean
The elevated success rate reflects one structural reality: only Phase I awardees can apply. This is not an open competition. Every applicant has already cleared NSF's initial scientific merit bar. You're not competing against the general population of innovative small businesses — you're competing against a curated group of companies that NSF already believed in once.
Nearly half of Phase II applicants still don't receive funding. Phase II reviewers scrutinize commercialization plans with far more rigor than Phase I, and they expect documented evidence that Phase I milestones were achieved. A promising technology with weak execution data or a vague market story will not be competitive. Strong underlying science is not enough on its own.
Success rates shift year to year based on appropriations levels, total applications received, and NSF's evolving program priorities. The FY2022 figure is the most recent confirmed number — check current solicitation data before drawing conclusions about the cycle you're planning for.
How NSF SBIR Phase II Differs from Phase I
Eligibility and the Structural Gate
Standalone Phase II at NSF is available only to recent NSF SBIR Phase I awardees, generally within 6–24 months of the relevant Phase I start date (individual award letters control the specific window). NSF does not offer a Direct-to-Phase-II option. The current Fast-Track pilot combines Phase I and Phase II in a single proposal and award path — but it does not skip Phase I work.
The Scope Shift
The difference in scope between Phase I and Phase II is substantial:
| Phase I | Phase II | |
|---|---|---|
| Award ceiling | Up to $305K | Up to $1.25M |
| Duration | 6–18 months | ~24 months |
| Primary question | Can this work? | Can this become a product? |
| Commercialization | Speculative plan | Concrete, evidence-backed roadmap |
| Technical focus | Feasibility proof | Prototype development and scale-up |
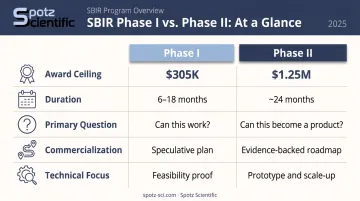
Your Phase I commercialization plan is a forward-looking argument. Phase II demands something grounded: customer discovery data, identified market segments, and a realistic path from prototype to revenue. By this stage, the core technical risk should be substantially reduced, with remaining uncertainties scoped and bounded.
The Application Process
No new Project Pitch is required for a standalone Phase II submission. You apply through Research.gov against a solicitation deadline. Core materials include:
- Phase I technical narrative
- Full project description and schedule
- Budget justification
- 15-page commercialization plan
- Biographical and current/pending support documents
- 3–5 customer or user letters of support
Phase II proposals undergo external technical and commercial review, followed by administrative and financial-capability review before awards are made.
NSF SBIR Phase II Award Size and Supplement Opportunities
NSF SBIR Phase II Award Size and Supplement Opportunities
Base Award
The current solicitation sets Phase II at up to $1.25 million over approximately 24 months. (Earlier NSF solicitations referenced $1.0 million — that figure is now superseded. Confirm the current ceiling in NSF's active solicitation before budgeting.)
Available Supplements
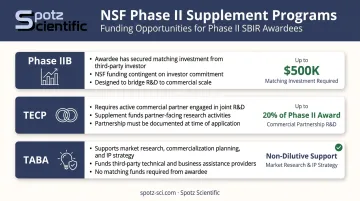
Phase II isn't just the base award. Three supplement mechanisms can extend total funding significantly:
| Supplement | Amount | Key Eligibility Rules |
|---|---|---|
| Phase IIB | Up to $500K (NSF matches $0.50 per $1.00 of qualifying investment) | Minimum $100K third-party cash commitment; debt instruments excluded; funds must support follow-on R&D. Details → |
| TECP (Technology Enhancement for Commercial Partnerships) | Up to 20% of original Phase II award | Covers up to 6 months of R&D to meet a commercial partner's technical specs; request must be submitted at least 6 months before award end; no-cost-extension awards are ineligible |
| TABA (Technical and Business Assistance) | Not specified in NSF 26-510 — contact NSF for current parameters | Optional, included within Phase II award; covers market research, IP strategy, regulatory guidance, and proposal consulting |
What NSF Looks for in a Winning Phase II Proposal
The Three-Criterion Framework
NSF SBIR evaluates proposals on three criteria: Intellectual Merit, Broader Impacts, and Commercial Potential. Standard NSF research grants use only the first two. Commercial Potential is an SBIR-specific addition — and for Phase II, it carries real weight.
The relative weighting of these criteria is not officially stated in NSF 26-510, but the program's structure makes the commercial criterion impossible to treat as secondary. NSF's entire SBIR mandate is about moving technology from the lab toward the market. A proposal that reads as primarily academic will not succeed here.
Demonstrated Phase I Progress
Reviewers expect clear evidence that Phase I milestones were achieved and that the core technical risk identified at the outset has been substantially reduced. This is not the place to explain why milestones slipped or to reframe what "success" means. If Phase I results are incomplete or ambiguous, the Phase II proposal will be fighting uphill regardless of the technical vision.
Document your Phase I outcomes specifically — data, prototypes, test results, failure modes investigated. Vague summaries signal that progress was limited.
The Commercialization Plan
NSF requires a 15-page commercialization plan with four sections: Market Opportunity; Company/Team; Product/Technology and Competition; and Finance and Revenue Model. Common weaknesses include:
- Market size claims without sourcing or methodology
- Customer segments defined too broadly to be credible
- No evidence of actual customer conversations or discovery
- A revenue model that assumes adoption rather than earning it
NSF views I-Corps participation during Phase I as evidence of structured customer discovery. Three to five customer/user letters of support provide additional market validation. If your commercialization plan reads like it was written in a week, reviewers will notice.
Team and Organizational Capacity
NSF assesses whether your team has the skills, experience, and institutional resources to execute a two-year development program. Gaps in business, regulatory, or commercialization expertise should be acknowledged and addressed — not ignored. Options include:
- Named advisors with relevant domain expertise
- Planned hires tied to specific project phases
- TABA-funded third-party support for commercialization gaps
Silence on a visible gap reads as unawareness, not confidence.
A technically strong proposal with a weak commercialization section will not succeed at NSF SBIR Phase II. An independent review before submission — from someone who understands how program managers actually read these documents — catches the gaps applicants miss when they're too close to their own work. Spotz Scientific offers that perspective directly: Dr. Bill Spotz spent eight years as a program manager at DOE's ASCR office, overseeing more than $264 million in scientific computing research.
How NSF Phase II Stacks Up Against Other Agencies
Success Rate Comparison
Using the most recently confirmed data available:
| Agency | Phase II Success Rate | Data Source |
|---|---|---|
| NSF | 49% (FY2022) | SBA FY2022 Annual Report |
| DOE | 36% (FY2022) | SBA FY2022 Annual Report |
| DoD | 30% (FY2022) | SBA FY2022 Annual Report |
| NIH | 24% (FY2024) | NIH Data Book |
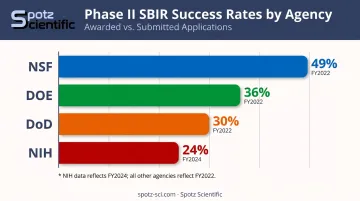
NSF has the highest Phase II selection rate among these agencies in the available data — though years differ for NIH, so treat the NIH figure as directionally useful, not directly comparable.
What Makes NSF Structurally Different
NSF does not publish predefined technology topics. You propose the problem and the solution. This open-ended mandate suits early-stage, highly innovative companies, but it also means the commercialization argument must be entirely self-constructed.
At DoD, the government defines the need; your job is to address it. At NSF, you have to convince reviewers that the need exists, that your solution addresses it, and that a viable market path follows. That's a harder narrative to build from scratch.
Award Size and Duration
- NSF Phase II: Up to $1.25M, ~24 months
- DOE Phase II: Up to $1.1M or $1.6M depending on topic, up to 2 years
- NIH Phase II: Varies by institute; historically tends toward higher average awards with longer potential durations
- DoD Phase II: Typically 15–24 months; structure varies by service branch
These are ceiling figures, not average awards. No comparable official average-by-agency table is publicly available.
Frequently Asked Questions
What is the success rate of NSF SBIR Phase II?
NSF SBIR Phase II success rates have ranged from approximately 43% (FY2017) to 49% (FY2022) based on SBA annual reports. This is far higher than Phase I (11% in FY2022) because the applicant pool is limited to Phase I awardees. Check NSF's current solicitation and the SBA's impact reports for the most recent cycle data.
How much is the NSF SBIR Phase II award?
The current base award is up to $1.25 million over approximately 24 months per NSF 26-510. Supplement programs — Phase IIB, TECP, and TABA — can extend total funding considerably beyond that base. Check NSF's active solicitation for any updates — Congress can revise these ceilings.
Who is eligible to apply for NSF SBIR Phase II?
Phase II eligibility is limited to companies that received an NSF SBIR Phase I award — typically applying within 6–24 months of the Phase I start date — and can demonstrate that Phase I milestones were met. NSF does not offer a Direct-to-Phase-II option.
What does NSF look for in a Phase II proposal that it does not emphasize as heavily in Phase I?
Phase II proposals are evaluated much more heavily on demonstrated Phase I progress and a concrete commercialization plan. Reviewers expect real customer discovery data, sourced market size claims, a credible revenue model, and evidence that the technology's core technical risk has been substantially reduced — not just a promising early result.
How long does it take to go from Phase I to Phase II at NSF?
The Phase II application window generally opens 6–24 months after the Phase I start date. After submission, panel review typically occurs 1–3 months post-deadline, with final notification approximately 5–7 months after the deadline. Current Phase II deadlines under NSF 26-510 include July 27, 2026; November 4, 2026; March 4, 2027; and July 7, 2027.